The College Stress Test: A Recipe for Institutional Resilience

You already know that I see our universities are the kitchens, and everything we do is a complex, high-stakes cooking process. And just like any good kitchen manager, we need a way to check our restaurant’s health and profitability. That’s why I’m talking about the “College Stress Test,” a powerful diagnostic tool that acts like a health inspection for the entire institution. It’s a data-driven model that helps us measure the financial and market pressures our kitchens are under.
The original concept comes from a book by Robert Zemsky, Susan Shaman, and Susan Baldridge, based on 2017 data. But of course, we’ve got to cook with fresh ingredients, right? So, I took our own 2024 data and applied the model to the Cal State system. The results give us a powerful diagnostic tool, a real-time report card on institutional resilience.
The Proof Is in the Pudding: How the Predictions Panned Out
The 2017 “College Stress Test” data was a powerful indicator of potential risks, and in many ways, the predictions have been spot-on. When it came to predicting a drop in customer foot traffic, the model’s forecast was chillingly accurate. It correctly flagged campuses like Cal Poly Humboldt, CSU-East Bay, and Sonoma State University for significant enrollment stress. And sure enough, these kitchens have since experienced severe customer declines. The model also precisely predicted that CSU Channel Islands, San Francisco State University, and CSU Northridge would face pressure, a prediction that has also been borne out by the numbers.
However, the model’s financial health predictions are a little more complex. The 2017 data flagged several kitchens for high Market Price Stress, but the CSU system as a whole has managed to avoid a widespread financial crisis. Why? Well, it turns out our system’s collective strength has provided a major buffer. The CSU has benefited from increased state appropriations and has been able to maintain a strong financial position, supported by high bond ratings and significant reserves. Federal pandemic relief funding also provided a massive injection of cash that helped individual campuses weather the storm. However with the current budget cuts, our system’s future is quite unpredictable. While some campuses have had to make budget adjustments, the system’s ability to manage funding shifts and leverage its collective resources has proven to be a vital ingredient that the original model couldn’t fully predict.
The Four Ingredients of a Healthy Kitchen
The stress score is a cumulative metric that gives us a snapshot of institutional health, and it’s made up of four key components, each with a maximum score of three points. Think of them as the four main ingredients we have to work with in our recipe for institutional resilience.
The Enrollment Stress Score is the first ingredient, and it’s all about our most vital resource: our customers—the students. It measures changes in customer foot traffic, focusing on trends in our undergraduate and first-time numbers. When this score is high, it’s a signal that we’re struggling to fill our seats, which is a major red flag for a public kitchen.
Next, we have the Retention Stress Score, which is all about keeping our customers happy and coming back for more. This ingredient measures our ability to keep students enrolled from one year to the next. A low score is a sign of a healthy, supportive kitchen environment, while a high score can point to deeper issues with academic support, campus life, or even the initial customer experience.
The Market Price Stress Score is our third ingredient. It’s a measure of our pricing power and a key indicator of our market position. It looks at how our net tuition revenue per student has changed over time. If this score is high, it can mean that a kitchen is having to offer more discounts to attract customers, which can put pressure on its bottom line.
Finally, we have the State Appropriation Stress Score. For our public kitchens, this ingredient is a measure of how our state funding has changed. Since the Cal State system is so dependent on state support, a high score here could signal a difficult road ahead for institutional stability.
Taking a Bite Out of the National Market
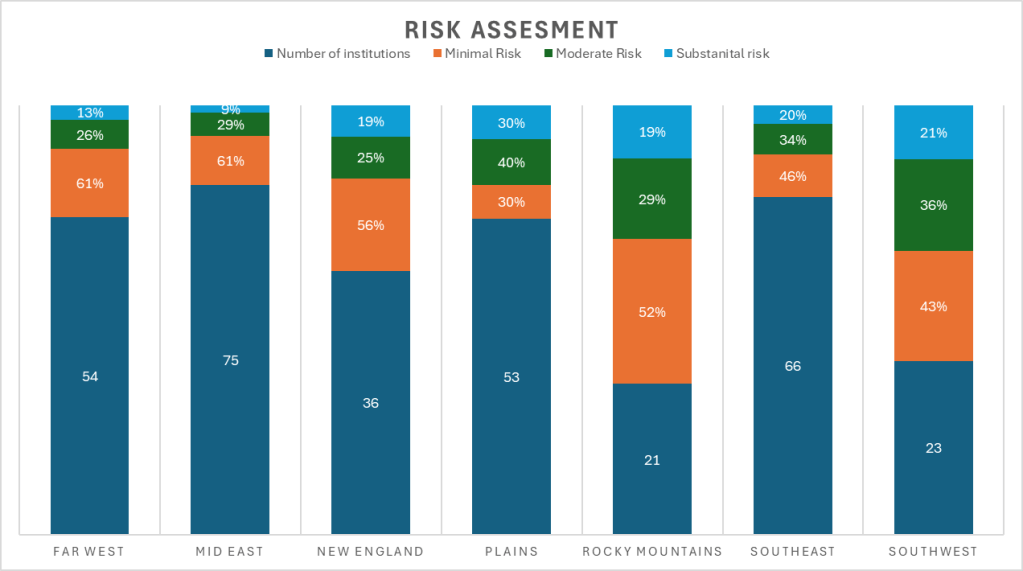
Before we dive into our own kitchen, let’s take a look at the national market. The data provides a fascinating overview of institutional health by region, showing us that risk is not spread evenly across the country. We see that the Far West and Mid East regions look quite similar, with a majority of institutions (61%) at Minimal Risk. However, both regions also have a substantial number of schools in the moderate and even high-risk categories, with stress scores that climb as high as 8 or 9. The New England region, with 36 institutions, has a wider spread of risk, with more schools landing in the moderate-to-high score range.
Meanwhile, the Plains region is definitely under a lot of pressure. It has the highest percentage of schools at Moderate Risk (40%) and a whopping 30% at Substantial Risk. This makes it the region with the highest overall stress level. The Rocky Mountains and Southeast regions present a more balanced picture, though the Southeast still has a high percentage of schools in the moderate and substantial categories. Finally, the Southwest shows a wide distribution of financial health, with many institutions falling into a range of stress scores from 1 to 8. It’s clear that in the national higher education market, a “one-size-fits-all” approach to enrollment management just won’t cut it.
The Main Course: A Detailed Look at the CSUs
Now, let’s bring this home and look at our own Cal State kitchen. The data for the 20 CSU campuses reveals a mixed financial health landscape. While no campus is at “High Risk,” several show some concerning trends that we need to address.
The Minimal Risk Campuses
It’s great to see that a large number of our campuses are at Minimal Risk, with a stress score of 0. This is the gold standard! These institutions have a low probability of financial trouble and include some of our biggest players: Cal Poly San Luis Obispo, Cal Poly Pomona, CSU Bakersfield, CSU Chico, CSU Dominguez Hills, CSU Monterey Bay, CSU Sacramento, CSU San Marcos, CSU Stanislaus, San Diego State, and San Jose State.
The Moderate Risk Campuses
The next group has some significant stress points we need to keep an eye on, with scores ranging from 1 to 3. Cal State Maritime Academy, with a total score of 2, is under pressure from its Market Price Stress Score, as both actual and projected market prices have dropped. CSU Channel Islands, with a total score of 3, is facing stress from both declining enrollment and a struggling market price. CSU Fresno and CSU Fullerton both have scores of 2, driven primarily by negative market price trends. CSU Los Angeles has a particularly concerning score of 3, with a massive drop in market price. CSU San Bernardino (score of 2) and San Francisco State University (score of 2) are also seeing pressure from both enrollment and market price. Cal Poly Humboldt, with a score of 3, is under heavy stress from a steep drop in enrollment. Even CSU Long Beach has a score of 1 due to a projected decrease in market price.
The Substantial Risk Campuses
These campuses, with scores of 4 or higher, have multiple weak points compared to other public schools. CSU East Bay, with a total score of 4, is seeing significant declines in both enrollment and market price. CSU Northridge also has a total score of 4, with its main weakness coming from severe enrollment declines. Finally, Sonoma State University is facing a substantial risk with a score of 4, driven by an alarming drop in enrollment.
The Heart of the Matter: Student Demographics and Market Price
At the core of the Cal State system is our commitment to serving California’s diverse population, a majority of whom are first-generation, low-income, and Pell Grant-eligible students. This is the secret ingredient that makes our data so unique.
When we look at tuition, it’s easy to get caught up in the sticker price. But for our students, what truly matters is the market price—the actual cost to the student after financial aid. Since so many of our students qualify for grants and scholarships, the market price is often a fraction of the listed tuition. The data shows this dynamic at play; our tuition is a solid number, but the market price fluctuates, and a high score here signals that we’re having to give away more to attract students, which can put our revenue at risk. It’s a delicate balance of access and affordability, and it’s a constant consideration for us in enrollment management.
Cooking Up Success:
A key aspect of the “College Stress Test” framework is the ability to identify and respond to market risks, such as declining enrollment and low graduation rates. The following are two examples of regional public universities that successfully took on these challenges and turned their trends around.
Slippery Rock University (SRU)
Slippery Rock University, located in Pennsylvania, has successfully bucked the national trend of declining enrollment among regional public universities. In Fall 2025, SRU saw a 2.75% increase in total enrollment, marking its largest single-year increase in nine years and its largest incoming class since 2019. SRU has also achieved the highest first-to-second-year retention and four-year graduation rates within the Pennsylvania State System of Higher Education. The university attributes its success to a new strategic plan focused on being a “first-choice organization” by aligning academic programs with workforce needs, expanding student support services like career readiness initiatives and personalized advising, and committing to its mission of providing a high-quality, accessible education. You can find more details about SRU’s strategic plan here: https://www.sru.edu/about/strategic-planning
The California State University (CSU) System
While the provided data shows some individual CSU campuses facing stress, the system as a whole has demonstrated a remarkable ability to improve graduation rates on a large scale. The system’s four-year graduation rate for first-time freshmen more than doubled between 2013 and 2024, reaching an all-time high of 36.2%. A key factor in this success is the Graduation Initiative 2025, a strategic system-wide effort to boost graduation rates and eliminate achievement gaps. The initiative’s strategies include investing in more faculty, offering additional courses, providing proactive student support services, and streamlining the transfer process for community college students. The CSU system also actively works to address equity gaps, particularly for students from underrepresented minority and low-income backgrounds.
