This post was inspired by reading the book by Robert Zemsky, Susan Campbell Baldridge, and Susan Shaman “The College Stress Test” , which gave me the framework to analyze our systems and then map out our market for a comprehensive strategic view.

As Enrollment Management professionals in California, we’re keenly aware that the days of guaranteed growth and stable state funding are long gone. The higher education market is now a crowded, volatile landscape, and strategic survival demands a clear, data-driven diagnosis.
Part I: The College Stress Test Overview
A few weeks ago, I found a book titled “The College Stress Test.” It is authored by Robert Zemsky, Susan Shaman, and Susan Campbell Baldridge. The book was a quick and easy read, with focus on precise, quantifiable risk analysis. Drawing heavily on IPEDS data, the book provides a methodology to assess an institution’s long-term market viability.
The CST measures institutional risk—or its “stress”—by examining four core variables. The first is the percentage change in the number of first-year students. The second is the change in the average tuition and fees after institutional financial aid, also known as net price. The third is the percentage of first-year students who return for a second year. The fourth is a measure of long-term financial stability and control of expenses.
I analyzed the data for 4-year institutions in California. The table 1 summarizes the risk public and private institutions in California face based on the proposed methodology. The data was extracted from Hanover Research website for Public Institutions and MindStream database for private institutions.
While 56% of institutions in our state face little risk, a critical 44% are “bound to struggle.” They must fundamentally change their curriculum, pricing, or instructional models to thrive. As the data shows, between 2019 and 2023, 5% of colleges within “Moderate” risk have either closed or merged with other colleges. Meanwhile, 20% within “Substantial” risk faced similar outcomes. Furthermore, 50% within “Severe” risk are no longer operating independently.
When applying the Stress Test logic to California’s public heavyweights, a clear distinction emerges. This distinction is based on market position and financial leverage.
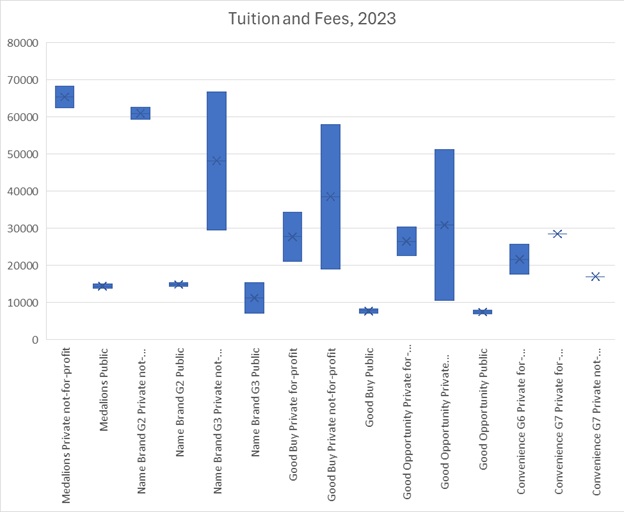
The UC system uses its status and subsidy to operate in a low-stress, high-demand segment of the market. The UCs charge tuition that is a fraction of their private peer institutions ($14,000s vs. $60,000s). This state-backed price advantage leads to massive market demand. This demand is self-stabilizing, ensuring high-quality applicants. It also ensures strong enrollment and retention (Pillars 1 & 3). Their research mission drives significant federal and private grant funding, bolstering financial resilience (CST Pillar 4).
The California State University (CSU) system, fulfilling the core access mission, is where the stress becomes acute. Many CSU campuses have struggled with enrollment stability post-pandemic, leading to significant revenue shortfalls. CSUs are committed to the lowest tuition levels ($7,000$ range) to fulfill their public access mandate. While this is critical for access, it causes critically low Revenue per FTE. Revenue per FTE is around $10,000 for the most accessible campuses. This structural constraint starves financial resilience, leading directly to the stress observed in graduation rate gaps. The CST shows that the challenge for many CSUs is more than under-performance. It is a systemic structural penalty for succeeding in their high-access, high-need mission. It’s amazing to explore the enrollment numbers. They reveal how our Cal State schools have performed over the past ten years! Here’s the exciting breakdown:
The Minimal Risk Campuses are absolutely crushing it, showing an 8% increase in overall enrollment—an incredible testament to their strength! Only two campuses, CSU Chico and CSU Dominguez Hills, saw a dip in their student populations.
On the other hand, the Moderate Risk Campuses are facing some challenges, with a collective 5% decrease in enrollment. Cal Poly Humboldt, San Francisco State University, and the former Maritime Academy felt the steepest declines. Each experienced more than a 20% drop in their student numbers.
Finally, the Substantial Risk Campuses are really feeling the heat. They are facing a significant 17% decline in total enrollment. Sonoma State University is unfortunately leading this difficult trend. It has a staggering 38% decline in its student population. These numbers give us a clear picture of where the market is shifting, and we’re thrilled to see the strength of the Minimal Risk group!
Table 1: Market Stress Test scores for 4-year institutions in California:
| Risk Type | Institutions |
| Minimal Risk (20% of all 4-year colleges in California) | UC Berkeley UC Davis UC Irvine UC San Diego UC Los Angeles UC Riverside UC Santa Barbara UC Santa Cruz CSU Bakersfield CSU Dominguez Hills CSU Chico CSU Monterey Bay San Diego State San Jose State Cal Poly Pomona CSU Long Beach CSU Sacramento Cal Poly San Luis Obispo CSU San Marcos CSU Stanislaus |
| Moderate Risk (56% of all 4-year colleges in California) | UC Merced CSU San Bernardino CSU Fresno CSU Fullerton Maritime Academy (Integrated with Cal Poly San Luis Obispo -July 2025) San Francisco State University CSU Los Angeles Cal Poly Humboldt CSU Channel Islands Chapman University Otis College of Art and Design University of San Diego California Baptist University Pomona College Concordia University Irvine Pitzer College University of the Pacific Mount Saint Mary’s University California Institute of the Arts William Jessup University Santa Clara University Dominican University of California Point Loma Nazarene University Westmont College Thomas Aquinas College Hope International University Woodbury University Loyola Marymount University The Master’s University and Seminary Fresno Pacific University Whittier College Simpson University (closed in 2023) University of San Francisco Saint Mary’s College of California University of La Verne Vanguard University of Southern California California Institute of Technology Life Pacific College Azusa Pacific University Southern California Seminary Pepperdine University Charles R Drew University of Medicine and Science Menlo College Holy Names University (Closed 2023) Scripps College La Sierra University Claremont McKenna College California Lutheran University California College of the Arts Biola University Laguna College of Art and Design Notre Dame de Namur University (Suspended Admissions/Programs as of 2021) San Diego Christian College San Francisco Conservatory of Music Pacific Union College Harvey Mudd College |
| Substantial Risk (20% of all 4-year colleges in California) | CSU East Bay CSU Northridge Sonoma State University Marymount California University (Closed 2022) San Francisco Art Institute (Closed 2022) Occidental College Southern California Institute of Architecture Bethany University (Closed 2011) Lincoln University John Paul the Great Catholic University University of Southern California Art Center College of Design Mills College (Merged to become Mills College at Northeastern University in 2022) University of the West Providence Christian College Soka University of America Shasta Bible College and Graduate School University of Redlands Stanford University American Jewish University |
| Severe Risk (4% of all 4-year colleges in California) | Patten University (Closed 2020) Brandman University (Renamed to UMass Global (2021) Humphreys University-Stockton and Modesto Campuses Zaytuna College |
Part II: Mapping the California Market Landscape
My curiosity arose from the CST. It led me to seek a deeper understanding of where California’s 4-year institutions truly sit competitively. After the approach, outlined in the broader “landscape” literature (often linked with Zemsky’s work), I used IPEDS data to map out market positions based on:
- Demand Score: Calculated using a combination of Admit and Yield Rates.
- Success Metrics: Primarily the 5-Year Graduation Rate (reflecting commitment to continuous enrollment).
- Accessibility: Measured by the Percentage of Part-Time Enrollment and the ratio of BA/BS degrees to total enrollment.
Based on Demand Score, Success Metrics, and Accessibility, I determined the 2023 market segmentation for California’s 4-year colleges. This includes both Private and Public institutions. This analysis was outlined in “The College Stress Test”. Since the entire list is composed of over 90 institutions, I will focus on Cal State and University of California.
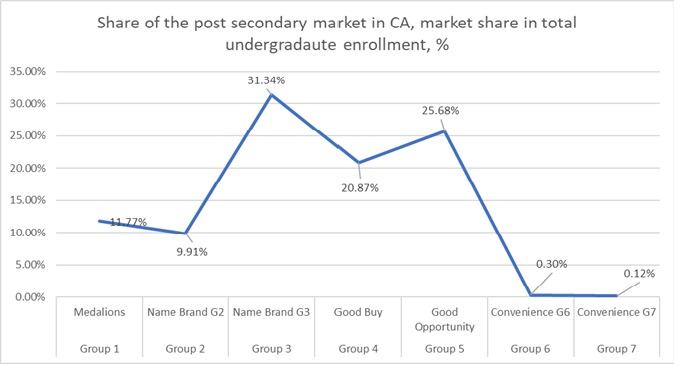
Medallions: the segment for which prestige-based ranking plays a significant role in defining institutional ambitions and quality. Their Market share is 7% of the total number of universities and 4-year colleges in California. A total of 12% of all undergraduate students in California are enrolled in “Medallions”. UC Berkeley and UCLA are the only two public universities within the Californian Medallion group.
Name Brand: the most institutions in this category practice selective admissions. This segment accounts for 31% of the number of higher education institutions in California. A total of 47% of all undergraduate students in California are enrolled in “Name Brands”. Other Californian Name Brands include the rest of the UC Campuses, San Diego State, Cal Poly San Luis Obispo, and Cal State Long Beach.
Good Buy: the most institutions offer full-scale undergraduate programs at prices significantly less than those of higher ranked institutions. This group accounts for 34% of the total number of universities and 4-year colleges in California. A total of 19% of all undergraduate students in California are enrolled in “Good Buys”. Cal Poly Pomona, Cal State Monterey Bay, Chico State, San Jose State, Cal State Stanislaus, Cal State Fullerton and Sonoma State are all “Good Buy” brands.
Good Opportunity: a segment comprising institutions and students who see higher education as a special opportunity. Many students who shop in this segment are the first in their families to attend the college. Colleges in this group account for 22% of the market share. A total of 21% of all undergraduate students in California are enrolled in “Good Opportunity” HEIs. The majority of regional Cal States represent this segment. These include Bakersfield, Domingues Hills, Sacramento, San Marcos, San Bernardino, Fresno, San Francisco State, Cal State LA, Cal Poly Humbold, Channel Islands, Northridge, and East Bay.
Convenience: dominated by part-time and intermittent learners. Students in this category often look for a friendly environment at an institution that understands special needs, including the need to take courses at convenient times. This is the smallest segment with only 3% of market share and enrollment (0.14% of all undergraduates in California)
My analysis confirms the California market is heavily concentrated in the Name Brand (G2 & G3). These segments have high demand and stable growth. Other large segments are Good Buy (G4) & Good Opportunity (G5). Those segments contain the highest volume of institutions, particularly the CSU campuses tasked with the mass-access mission.
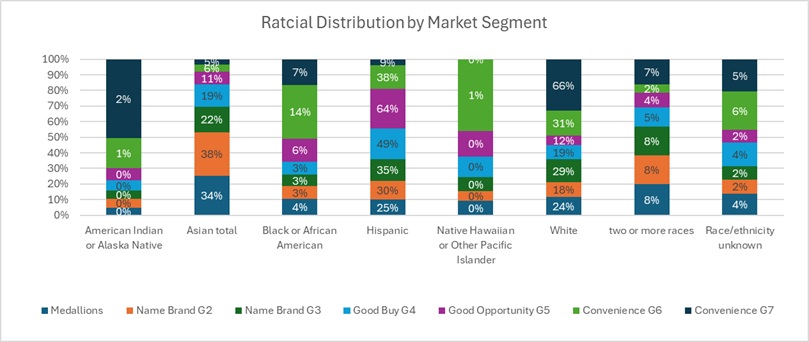
The most profound finding is the direct link between market position and financial vulnerability. The Good Opportunity (G5) segment, dominated by Cal State, has the highest concentration of Hispanic students (up to 63.8% of FTF cohorts), is the market segment with the lowest average Revenue per FTE ($10,109$).
This confirms a critical policy contradiction. The institutions doing the most for equity and access face the greatest financial duress. They are perpetually struggling in the high-stress category of the CST.
for institutions in the crowded “Core,” being “stuck in the middle” – G4 and G5 segemens- is no longer a viable strategy. The market is pressuring the Core from two directions:
Pressure from the Left: Elite UCs siphon off high-achieving students.
Pressure from the Right: Agile “Convenience” (G6/G7) providers are often for-profits. They are aggressively capturing the non-traditional, working-adult market. In some segments, growth rates exceed 100%.
To move from High Stress to Resilience, Enrollment Management must push for an unambiguous strategic shift:
- Shift Left (Status): Dramatically increase academic success velocity to drive up status and demand, mirroring the resilient CST campuses.
- Shift Right (Convenience): Aggressively align with the flexible, non-traditional learner market. Consider redirecting capital from costly, low-impact technology. This includes things like opaque predictive models. Instead, focus on flexible delivery and high-impact human services.
The CST and market segmentation are not just academic tools; they are the road map for survival. Institutional leaders must use this data to make radical, clear choices before structural financial penalties condemn them to the struggling 30%.
