The financial DNA of California colleges: Following the Money Trail from Medallions to Convenience
It’s been a little while since the last post, and I’m excited to dive into a critical analysis that gets right to the heart of institutional strategy and financial sustainability: the financial DNA of our California colleges. All the compelling data presented here comes directly from the IPEDS 2023 Fiscal Year data for the state’s four-year institutions.
Analysis of IPEDS 2023 data demonstrates that market positioning profoundly shapes the financial strategies of California’s 4-year colleges, showing a critical funding gap where high-access institutions serving the most Pell-eligible students are the most exposed to state funding volatility.
Applying the market segments outlined in The College Stress Test to this new data reveals that the financial differences between institutions are not merely budgetary; they are a direct reflection of strategic intent and the cost of sending a specific market signal. This analysis is essential for informing institutional strategy and enrollment management practices.
Each college segment tells a unique financial story through its revenue generation and expenditure allocation. Let’s examine four key groups: the exclusive Medallions, the ambitious Brand Names, the essential Good Opportunity colleges, and the highly accessible Convenience institution.
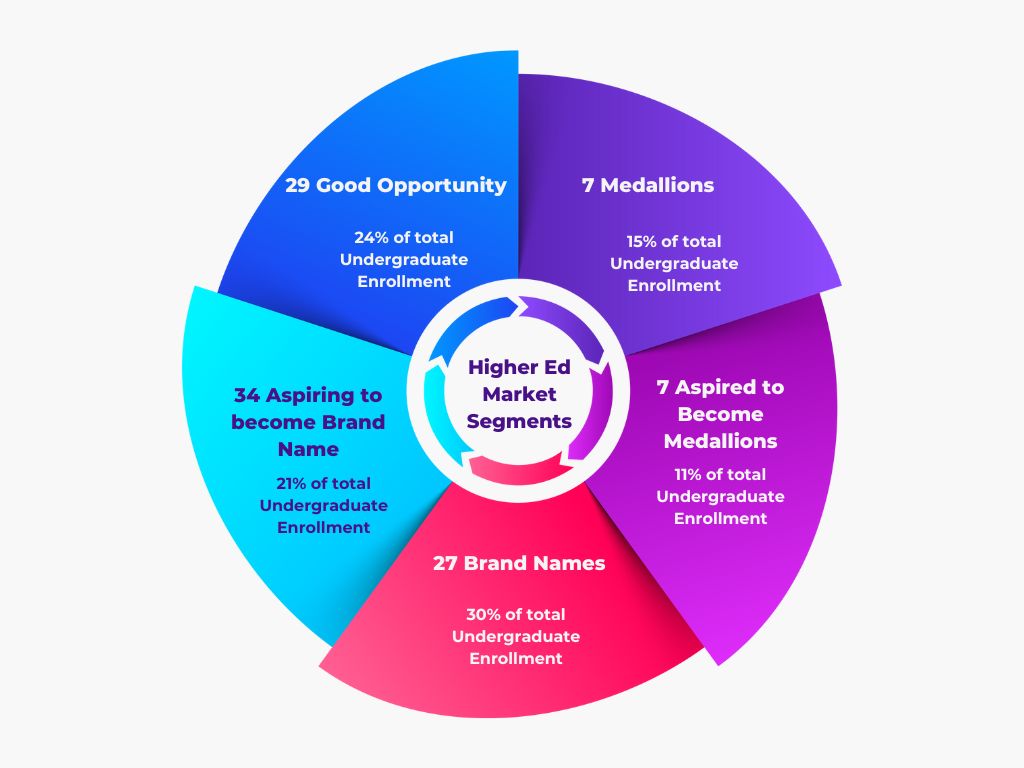
Market Segmentation of bachelor’s degree granting higher education Institutions in California, 2024
The Medallions: The Cost of Prestige
The Medallions, which include institutions like Caltech, UCLA, USC, and the Claremont Colleges (Pomona, CMC, Harvey Mudd), operate as high-prestige brands. Their primary goal is maintaining a strong market signal of selectivity and academic excellence.
| Revenue Type | % of Total Revenue per FTE | Expense Type | % of Total Expense per FTE |
| Investment Return | 26% | Instruction expenses | 38% |
| Private Gifts | 25% | Research expenses | 24% |
| Tuition and Fees | 17% | Institutional Support | 14% |
Medallions exhibit significant financial resilience, with tuition and fees accounting for a minor portion of their total revenue. Their financial strength is derived from substantial private gifts, grants, and contracts and considerable investment returns. The allocation is strategic, prioritizing the maintenance of their global reputation. The top expenditures are Instruction and Research.
The Brand Names: The Tuition-Driven Model
The Brand Names (27 institutions) represent the quintessential modern university model, heavily reliant on tuition revenue to fund their operations. Several Cal States (Cal Poly San Luis Obispo, CSU Long Beach, San Diego State), the majority of University of California campuses, and several private universities like Chapman, Pepperdine, California Lutheran University, University of San Diego.
| Revenue Type | % of Total Revenue per FTE | Expense Type | % of Total Expense per FTE |
| Tuition and Fees | 55% | Instruction expenses | 39% |
| Private Gifts | 12% | Student Service expenses | 17% |
| Investment Return | 9% | Institutional Support | 18% |
Their business model is highly sensitive to enrollment figures, as tuition and fees make up 55% of their total revenue. Expenditures reflect a commitment to a comprehensive student experience. While instruction is key, they allocate a significant budget to Student Services (admissions, registrar, student wellbeing, etc.), which is required to deliver and support a broad-based undergraduate education.
The Good Opportunity Colleges: The Public Service Mission
These institutions, including 12 out of 23 CSU campuses, are critical for social mobility and public access, often carrying the largest burden of serving high-need populations.
| Revenue Type | % of Total Revenue per FTE | Expense Type | % of Total Expense per FTE |
| State Appropriations | 24% | Institutional support expenses | 27% |
| Tuition and Fees | 41% | Instruction expenses | 25% |
| Private Gifts | 17% | Academic support expenses | 20% |
Public institutions within this segment demonstrate a profound commitment to access, with 58% of their full-time first-time students identified as Pell-eligible. Their reliance on state support is pronounced: State Appropriations account for 24% of their revenue (for public institutions in this group), making them vulnerable to public funding fluctuations. Tuition and fees account for 41% of revenues – somewhere in between Medallions and Brand Names.
The financial structure of the Good Opportunity segment reveals two significant areas of concern that expose them to risk and question the efficiency of their spending, especially given their high-access mission.
A negative investment return of -1% for this segment (across all institutional control types) signals a significant financial weakness. This loss removes a crucial financial buffer that highly-resilient institutions use to absorb shocks and invest in student services. For colleges serving a high proportion of Pell-eligible students, this vulnerability is compounded, potentially requiring them to increase tuition or reduce expenditures on core services—strategies that disproportionately affect low-income students.
The allocation of a massive 27% of core expenses to Institutional support is the highest percentage among all segments, nearly double that of Medallions (14%). This high figure raises a critical concern about “administrative bloat”—spending on non-instructional functions that may not directly translate to improved student outcomes or affordability.
The spending breakdown for Good Opportunity institutions appears misaligned with a primary focus on access and instruction since Institutional Support (27%) exceeds Instruction (25%). This suggests that the cost of running the bureaucracy is a greater budgetary priority than the core act of teaching, which can diminish institutional capacity and threaten broad access. Streamlining administrative processes is a key strategy for institutions aiming to keep costs down and alleviate the burden on students.
Strategic Lessons for Broad-Access Brands
The financial health of the Medallion segment is a function of actively funding their strategic signal. Broad-access and Convenience institutions must adapt key revenue and efficiency strategies to stabilize their mission-critical operations.
Fund the Cost of Care Separately (The Medallion Revenue Play): Medallions use Private Gifts and Investment Return to fund their prestige (Research). Broad-access colleges must aggressively pursue targeted private funding to cover the high cost of holistic support for their Pell-eligible students. Critical support services should not be left vulnerable within the operational budget.
Maximize Diverse Core Revenues (The Convenience Agility): Good Opportunity institutions have the lowest share on other core revenues (5% compared to 11% for Medallions). Broad-access peers must explore entrepreneurial revenue generation, grants, and specialized partnerships to reduce dependence on tuition and state appropriations, directly funding their unique service missions.
Prioritize Efficiency and Student-Facing Spend (The Critical Lesson): The high Institutional Support costs in the Good Opportunity segment must be addressed by streamlining administrative processes and reducing unnecessary spending. Every budgetary decision must be justified by its contribution to student success and retention, aligning resources with the high-need population these institutions serve.
